Track Your Inspection Progress
At the top of your dashboard, you'll see three important cards that give you an instant overview of your audit activity. These numbers tell you exactly what's happening with your audits right now.
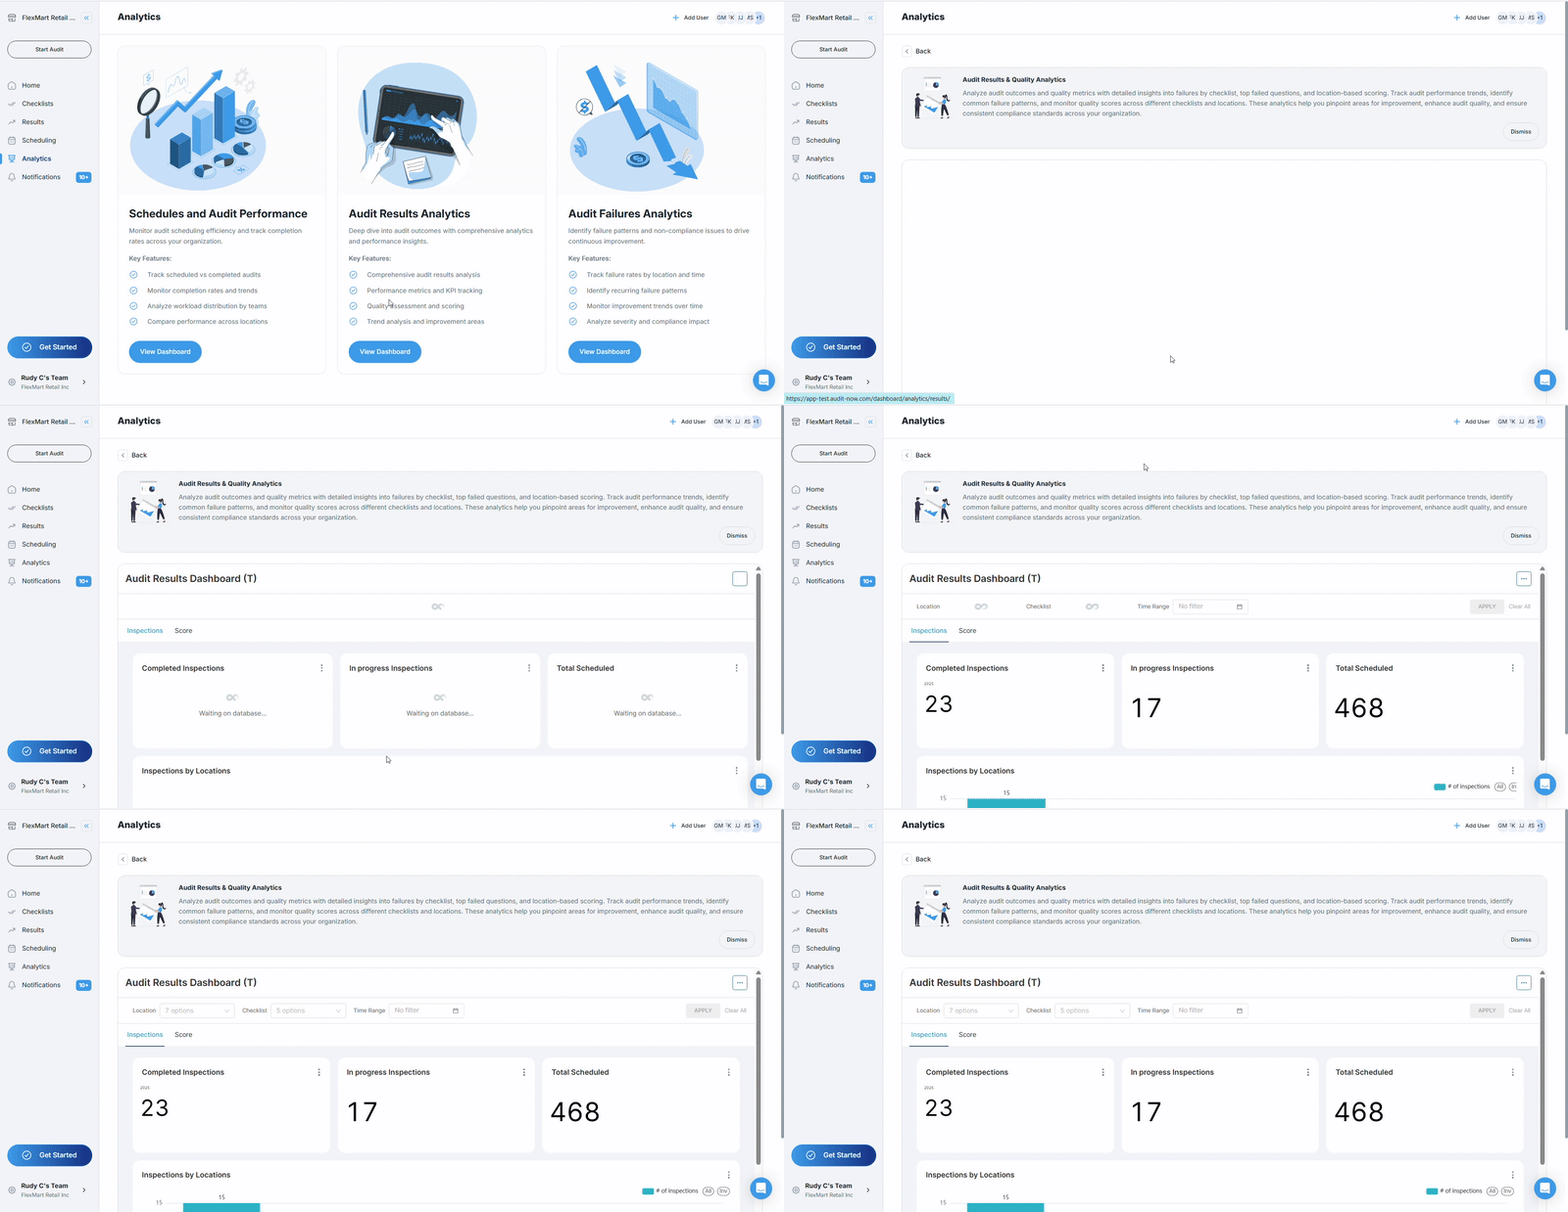
The Three Key Numbers:

Completed Inspections
- Shows audits that are 100% finished and submitted
- This is your "work accomplished" number
In Progress Inspections
- Shows audits that someone started but hasn't finished yet
- These need follow-up to get completed
Total Scheduled
- Shows all audits planned for your selected time period
- This is your target - what you aimed to accomplish
What these numbers tell you:
- Good progress: When completed numbers are close to your scheduled total
- Need attention: When you have many in-progress audits sitting unfinished
- Behind schedule: When completed + in-progress is much less than total scheduled
Quick tip: These numbers change based on your time range filter. If you're looking at "last 30 days," you'll see different numbers than if you're looking at "this week."
Monitor Inspections by Location
The "Inspections by Locations" chart shows you a bar graph of how many audits each of your locations has completed. This helps you see which sites are staying busy with audits and which might need more attention.
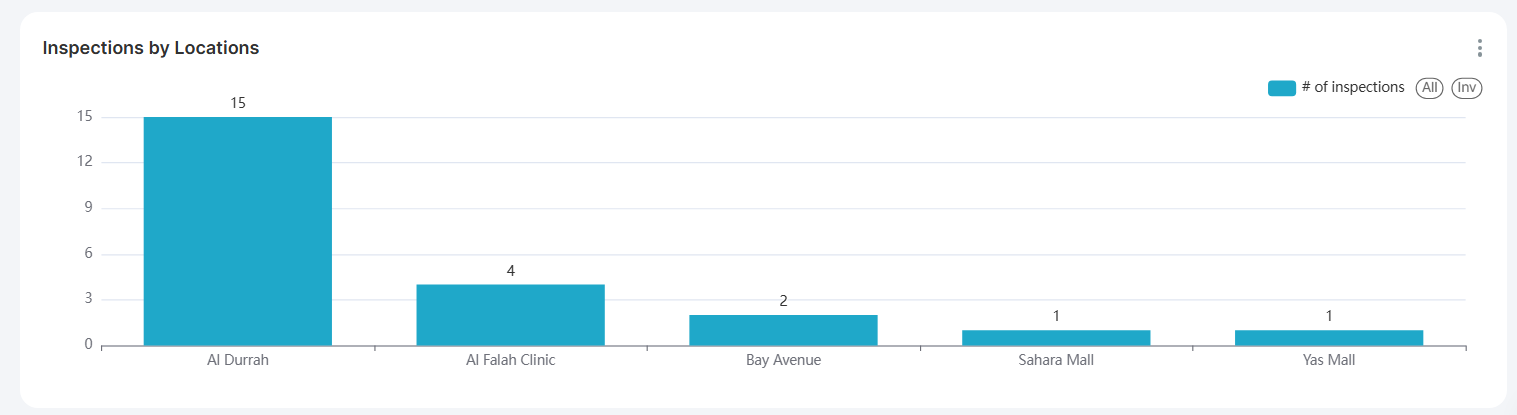
How to read this chart:
- Each bar represents one location (like stores, facilities, or sites)
- Taller bars = more audit activity at that location
- Shorter bars = less audit activity at that location
- No bar = no completed audits at that location during your time period
What this tells you:
- Consistent bar heights: Good distribution of audit work across locations
- One very tall bar: One location doing most of the audit work
- Many short bars: Audit activity is spread out but low overall
- Missing bars: Some locations haven't completed audits in your time frame
Action items:
- High-activity locations: Recognize these teams for staying on top of audits
- Low-activity locations: Check if they need help, training, or schedule adjustments
- No-activity locations: Investigate if there are barriers preventing audits
See Auditor Activity
The "Inspections by Auditor" chart shows you which team members are completing the most audits. This helps you understand workload distribution and identify your most active auditors.
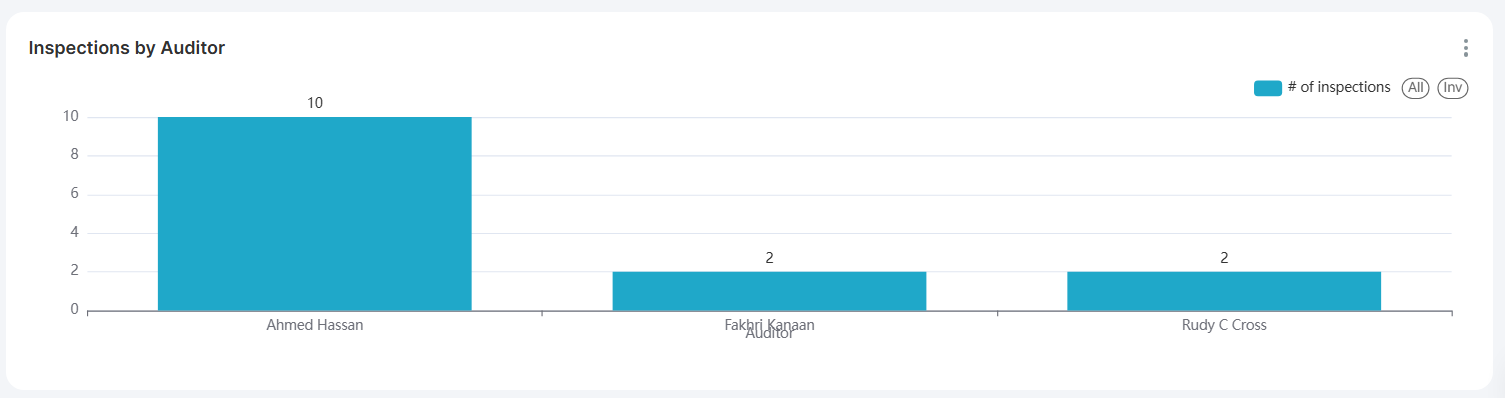
What you'll see:
- Individual bars for each auditor who completed audits
- Bar height shows number of completed inspections by that person
- Names or IDs of auditors along the bottom of the chart
When this chart shows no data:
- No audits were completed by individual auditors in the selected time period
- The filters are set too narrowly to show auditor data
- Auditor names aren't being tracked in the current data set
When this chart is populated, use it to:
- Identify top performers: Auditors completing the most inspections
- Balance workload: See if some auditors are overloaded while others have light loads
- Recognize contributions: Acknowledge team members who are staying active
- Spot training needs: Auditors with very low completion rates might need support
If you don't see data here:
- Try expanding your time range filter
- Clear location or checklist filters that might be limiting results
- Check that audits are being assigned to specific auditors in your system
Explore Scores
When you click the "Score" tab (instead of "Inspections"), your dashboard transforms to show performance quality rather than just activity counts.
Overall Score
- Shows your organization's average score across all completed audits
- When populated, you'll see a single number (like 85%) representing your overall performance
- May show "No data" if no scored audits exist in the current filter settings

Overall Score Trend
- Displays a line graph showing how your scores change over time
- Rising line: Scores are improving over time (good news!)
- Falling line: Scores are declining (needs attention)
- Flat line: Consistent performance over time
Avg Scores by Locations
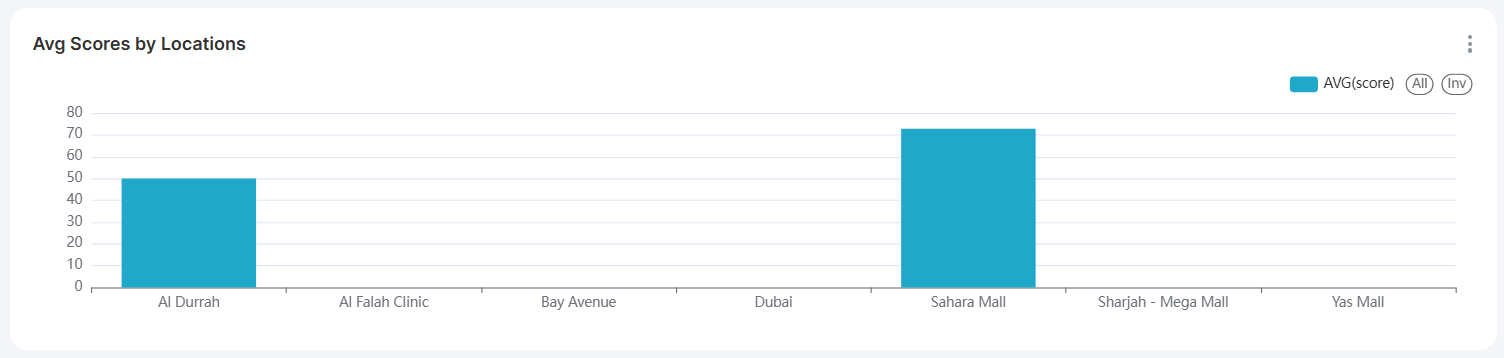
- Bar chart showing average audit scores for each location
- Taller bars: Locations with higher average scores
- Shorter bars: Locations with lower average scores
- Missing bars: Locations with no scored audits in your time period
- Use this to identify your best-performing and struggling locations
Avg Scores by Checklists
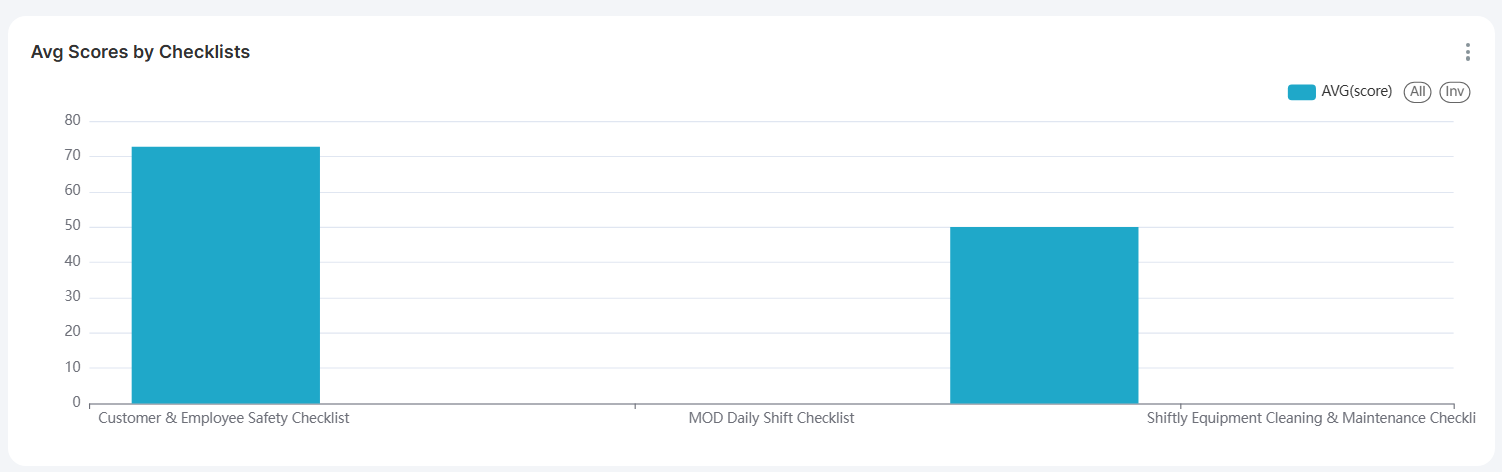
- Bar chart showing average scores for different types of audits
- Helps you see which audit types are performing well vs. poorly
- High bars: Audit types where you consistently score well
- Low bars: Audit types that might need process improvements
Why you might see "No data":
- No audits with numerical scores in your selected time period
- Your checklists use pass/fail instead of numerical scoring
- Filters are too restrictive and exclude all scored audits
- You're looking at a time period before scored audits were completed
Compare Location and Checklist Performance
This detailed chart (when available) shows you how each location performs on each type of audit. It's like a report card that breaks down performance by both location and audit type.
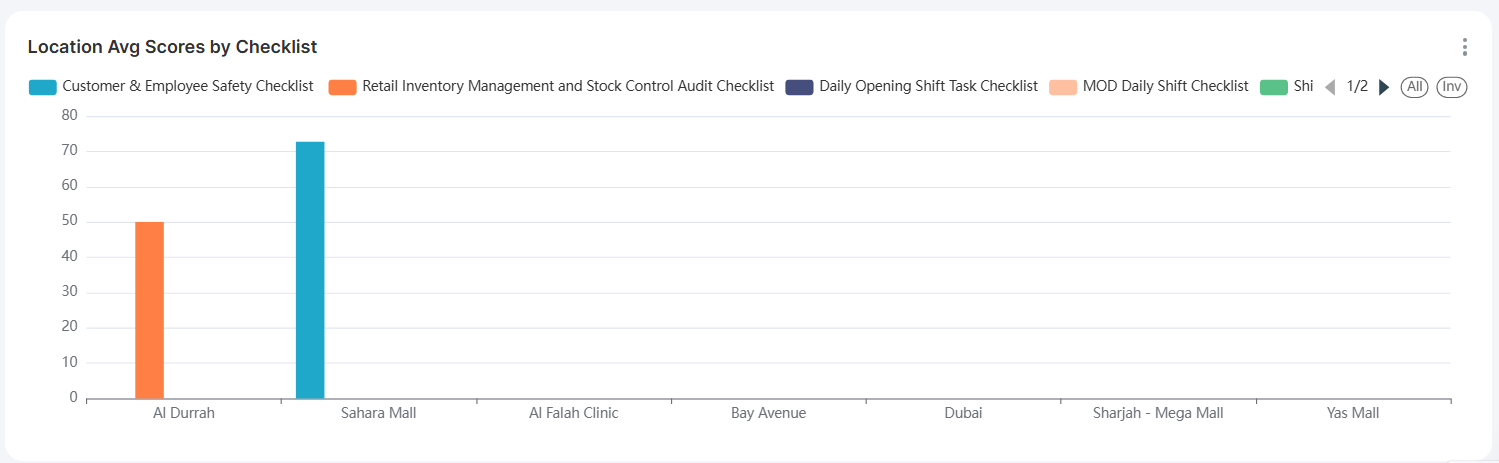
What this chart reveals:
- Which locations excel at specific audit types: Some stores might be great at safety audits but struggle with customer service audits
- Which audit types are consistently challenging: If all locations score low on one checklist type, it might indicate a training need
- Your overall strengths and weaknesses: Patterns across the entire organization
How to read it:
- Each group of colored bars represents one location
- Each colored bar within a group corresponds to a different checklist type
- Bar height indicates the average score for that checklist at that location
- Checklist names and colors are shown in the legend at the top