Overview
Findings and Actions Analytics transforms audit findings into actionable insights by tracking corrective action performance across your organization. Monitor action creation rates, completion trends, overdue patterns, and priority distributions to ensure audit findings drive meaningful operational improvements.
Understanding Findings and Actions Analytics
What the Analytics Provide:
- Action performance tracking: Monitor creation, completion, and overdue rates
- Priority distribution analysis: Understand the severity patterns of identified issues
- Location-based insights: Compare action performance across different sites
- Trend analysis: Track improvement patterns over time
- Effectiveness measurement: Assess how well findings translate into resolved actions
Key Benefits:
- Proactive management: Identify action bottlenecks before they impact operations
- Resource allocation: Focus corrective action resources where they're needed most
- Performance measurement: Quantify the effectiveness of your audit program
- Compliance tracking: Ensure timely resolution of critical findings
- Continuous improvement: Use data to optimize corrective action processes
Accessing Findings and Actions Analytics
Navigation:
- Click Analytics from your main navigation menu
- Select "Findings and Actions Analytics" from the analytics dashboard
- View comprehensive action performance data across multiple dimensions
Key Analytics Components
Action Performance Summary

Total Open Actions
- Definition: Number of actions currently requiring attention across all statuses except "Closed"
- Use for: Overall workload assessment and resource planning
- Monitoring: Track trends to identify increasing or decreasing action volumes
Overdue Actions
- Definition: Actions that have passed their due date without completion
- Use for: Identifying process bottlenecks and accountability issues
- Action required: Immediate attention to prevent compliance risks
Critical Priority Actions
- Definition: Actions marked as critical priority requiring urgent attention
- Use for: Risk management and priority resource allocation
- Monitoring: Ensure critical items receive appropriate urgency
Location-Based Action Analysis
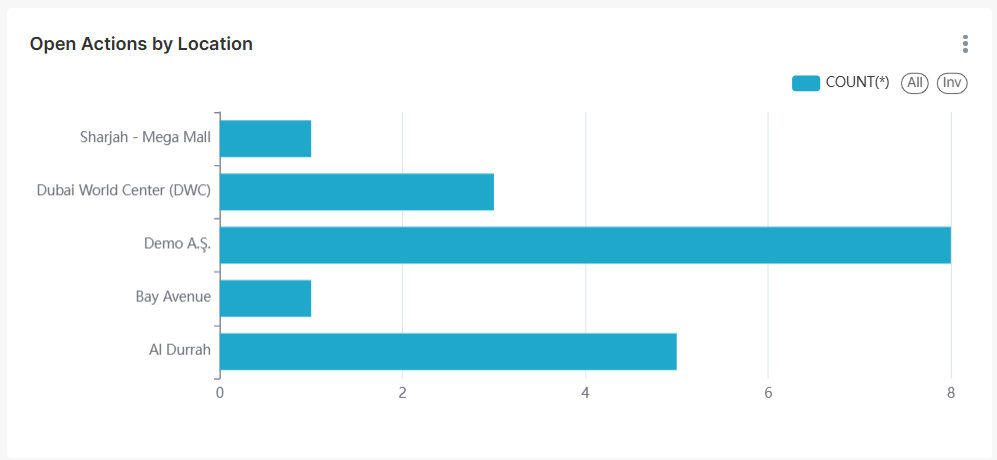
Open Actions by Location
Horizontal bar chart showing action distribution across your organization:
- Location comparison: Identify sites with higher action volumes
- Resource needs: Understand which locations need additional support
- Performance patterns: Recognize consistently high-performing vs. struggling locations
- Operational insights: Connect action volumes to operational complexity or issues
Using Location Data:
- Benchmark performance: Compare similar locations to identify best practices
- Allocate resources: Direct support to locations with higher action volumes
- Investigate patterns: Understand why certain locations generate more actions
- Share solutions: Replicate successful approaches from well-performing sites
Priority Distribution Analysis
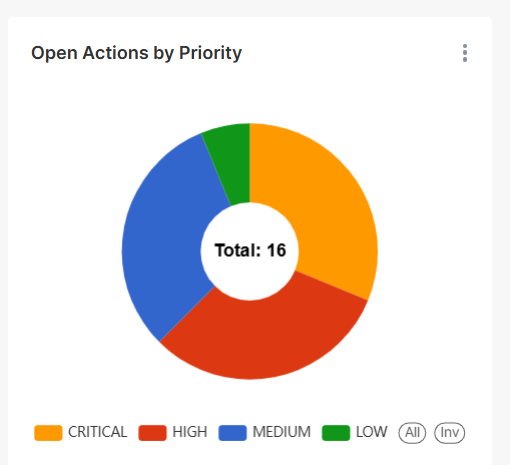
Open Actions by Priority
Pie chart visualization showing action distribution by priority level:
- Priority breakdown: Visual representation of Critical, High, Medium, and Low priority actions
- Risk assessment: Understand the severity distribution of current issues
- Resource focus: Ensure appropriate attention to high-priority items
- Trend monitoring: Track whether priority patterns are improving over time
Priority Categories:
- Critical (Red): Safety violations, regulatory non-compliance, operational risks
- High (Orange): Important operational issues requiring prompt attention
- Medium (Blue): Standard operational improvements and process enhancements
- Low (Green): Minor improvements and administrative items
Actions Listing: Detailed Action Tracking
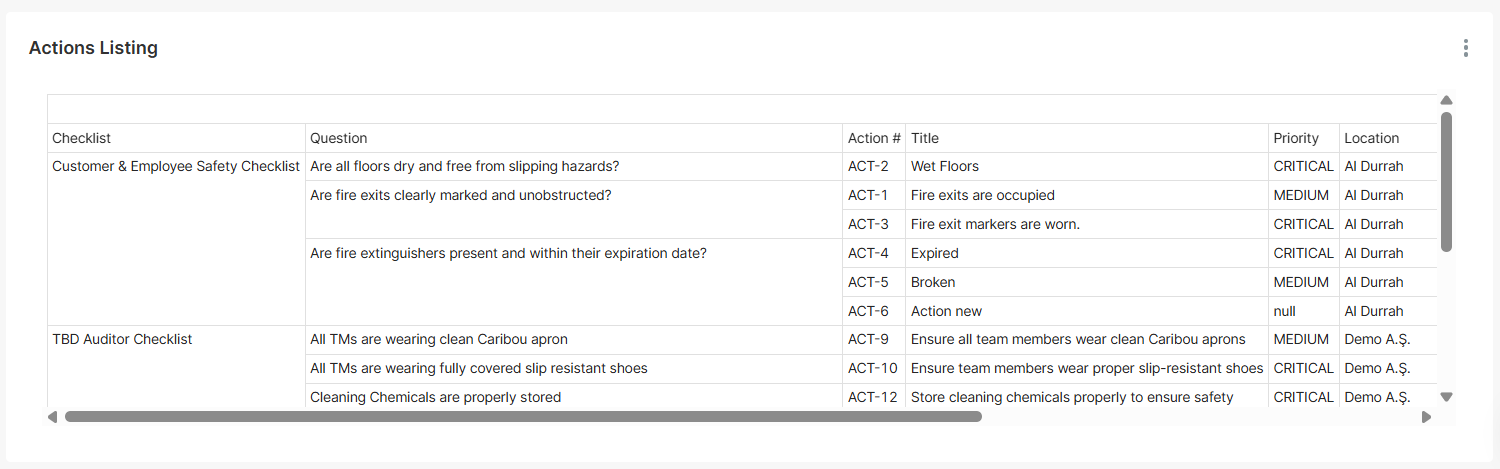
Comprehensive Action Overview
The Actions Listing provides detailed tabular data for in-depth action analysis:
Table Columns Explained
Checklist
- Shows: The audit checklist that generated the action
- Use for: Connecting actions back to specific audit types
- Analysis: Identify which checklists generate the most actions
Question
- Shows: The specific audit question that failed, creating the need for corrective action
- Use for: Understanding the root cause of actions
- Pattern recognition: Identify frequently failing questions for process improvement
Action #
- Shows: Unique action identifier (e.g., ACT-1, ACT-2, SAFETY-105)
- Use for: Reference and tracking individual actions
- Organization: Actions numbered sequentially based on template prefixes
Title
- Shows: Brief, descriptive summary of the required corrective action
- Use for: Quick understanding of what needs to be done
- Quality indicator: Well-written titles improve action clarity and completion rates
Priority
- Shows: Action urgency level (Critical, High, Medium, Low)
- Use for: Resource allocation and scheduling decisions
- Color coding: Visual priority identification for quick assessment
Location
- Shows: Physical or operational location where the action is required
- Use for: Geographic or operational analysis of action patterns
- Resource planning: Understanding location-specific action needs
Action Created
- Shows: Date and time when the action was generated
- Use for: Tracking action age and creation patterns
- Trend analysis: Understanding action generation frequency over time
Due By
- Shows: Target completion date for the action
- Use for: Deadline management and overdue identification
- Priority-based: Due dates often automatically calculated based on action priority
Status
- Shows: Current workflow status (Open, In Progress, Complete, etc.)
- Use for: Progress tracking and workflow management
- Workflow stage: Indicates where actions are in the resolution process
Assignees
- Shows: Individual users or user groups responsible for action completion
- Use for: Accountability tracking and workload distribution
- Performance measurement: Individual and team action completion rates